Baseline vs. CSFlow: Better image realism
 Baseline
 CSFlow (ours)
PixelGen-XXL/16 · text-to-image · 512×512
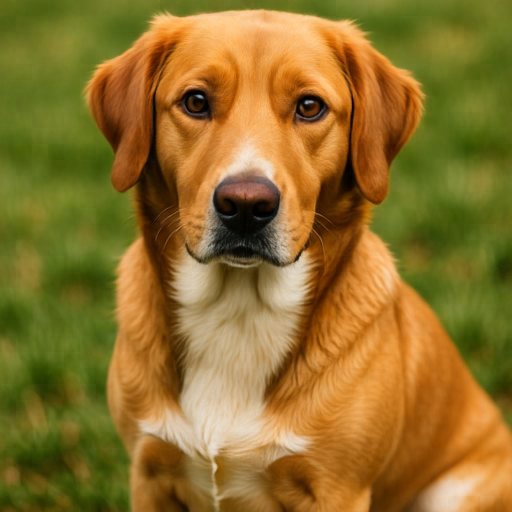 Baseline
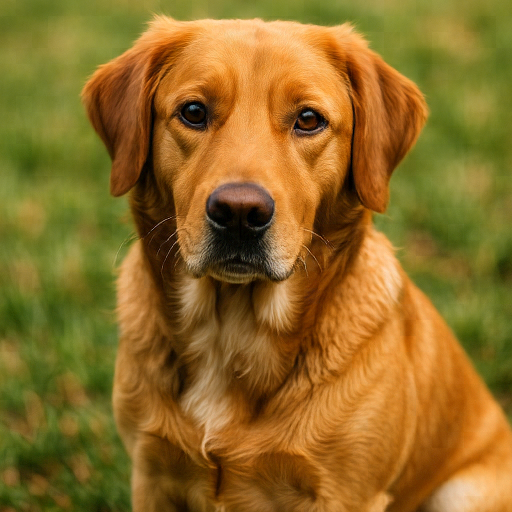 CSFlow (ours)
PixelGen-XXL/16 · text-to-image · 512×512
Aligning Flow Matching with Human Contrast Sensitivity
Max Planck Institute for Informatics, Saarland Informatics Campus
* Equal contribution
We introduce Contrast Sensitive Flow (CSFlow), a weighting scheme method for flow matching that prioritizes reconstruction of frequencies that are more important for the human eye. We combine two properties: first, that pixel-space image generation happens in a coarse-to-fine manner, where low frequencies are established before higher frequencies. Second, that the human eye is more sensitive to certain frequency bands. We redistribute several models' precision and capacity accordingly through a weighted inference and fine-tuning. The results: consistently better quantitative results (FID, GenEval) and images that look less "cartoonish" and oversmoothed, and achieve overall better realism.
Contrast Sensitive Flow (CSFlow) is a weighting scheme that connects the human eye's Contrast Sensitivity Function (CSF) to the iterative denoising steps of flow matching. Because real-world images concentrate signal at low spatial frequencies, these components reach high signal-to-noise ratio earlier during continuous diffusion than high-frequency components. When generating images with diffusion or flow matching models, this induces a soft autoregressive structure in Fourier space, where coarse image content stabilizes before fine detail. Meanwhile, the human visual system is unequally sensitive to spatial frequencies: very low and very high frequencies require significantly higher contrast to be perceived. We for the first time merge these observations through two contributions: (1) a metric that estimates which frequencies are generated at each reverse flow interval and (2) timestep weights obtained by aligning the frequencies generated at each noise level with human contrast sensitivity. We validate our contributions experimentally showing that these weights can improve generative performance by lowering FID by up to 12.15%, increasing Inception Score by up to 3.2% and improving GenEval scores by up to 3.0% using inference-only timestep modification or short fine-tuning. Qualitatively, we find that our CSFlow weights lead to better visual realism and less cartoonish appearance of generated images. In a two-alternative forced-choice study, participants preferred CSFlow generations over the baseline in 65% of comparisons.
Depending on the viewing distance and displayed image size, your ability to see certain frequencies changes, which is exactly what CSF measures. This is a Campbell–Robson chart — spatial frequency increases left→right, contrast fades top→bottom. The dashed line is the predicted human visibility threshold: adjust the viewing distance and physical image width and watch it shift, computed from the real Barten CSF (Appendix A) and the visual-angle conversion in Appendix D.
Move further from the screen, or make the displayed image wider, and the same image frequencies map to fewer cycles-per-degree — the visible threshold shifts toward finer detail.
CSFlow is built on the forward process - iterative noising, and reverted over the time, to analyze how the frequency content changes during denoising. We built it in four steps: (1) measure how recoverable each image-frequency is when image is noised, (2) measure which image-frequencies are reconstructed between the noising-timesteps, (3) weight it by contrast sensitivity, (4) aggregate the resulting timestep weights.
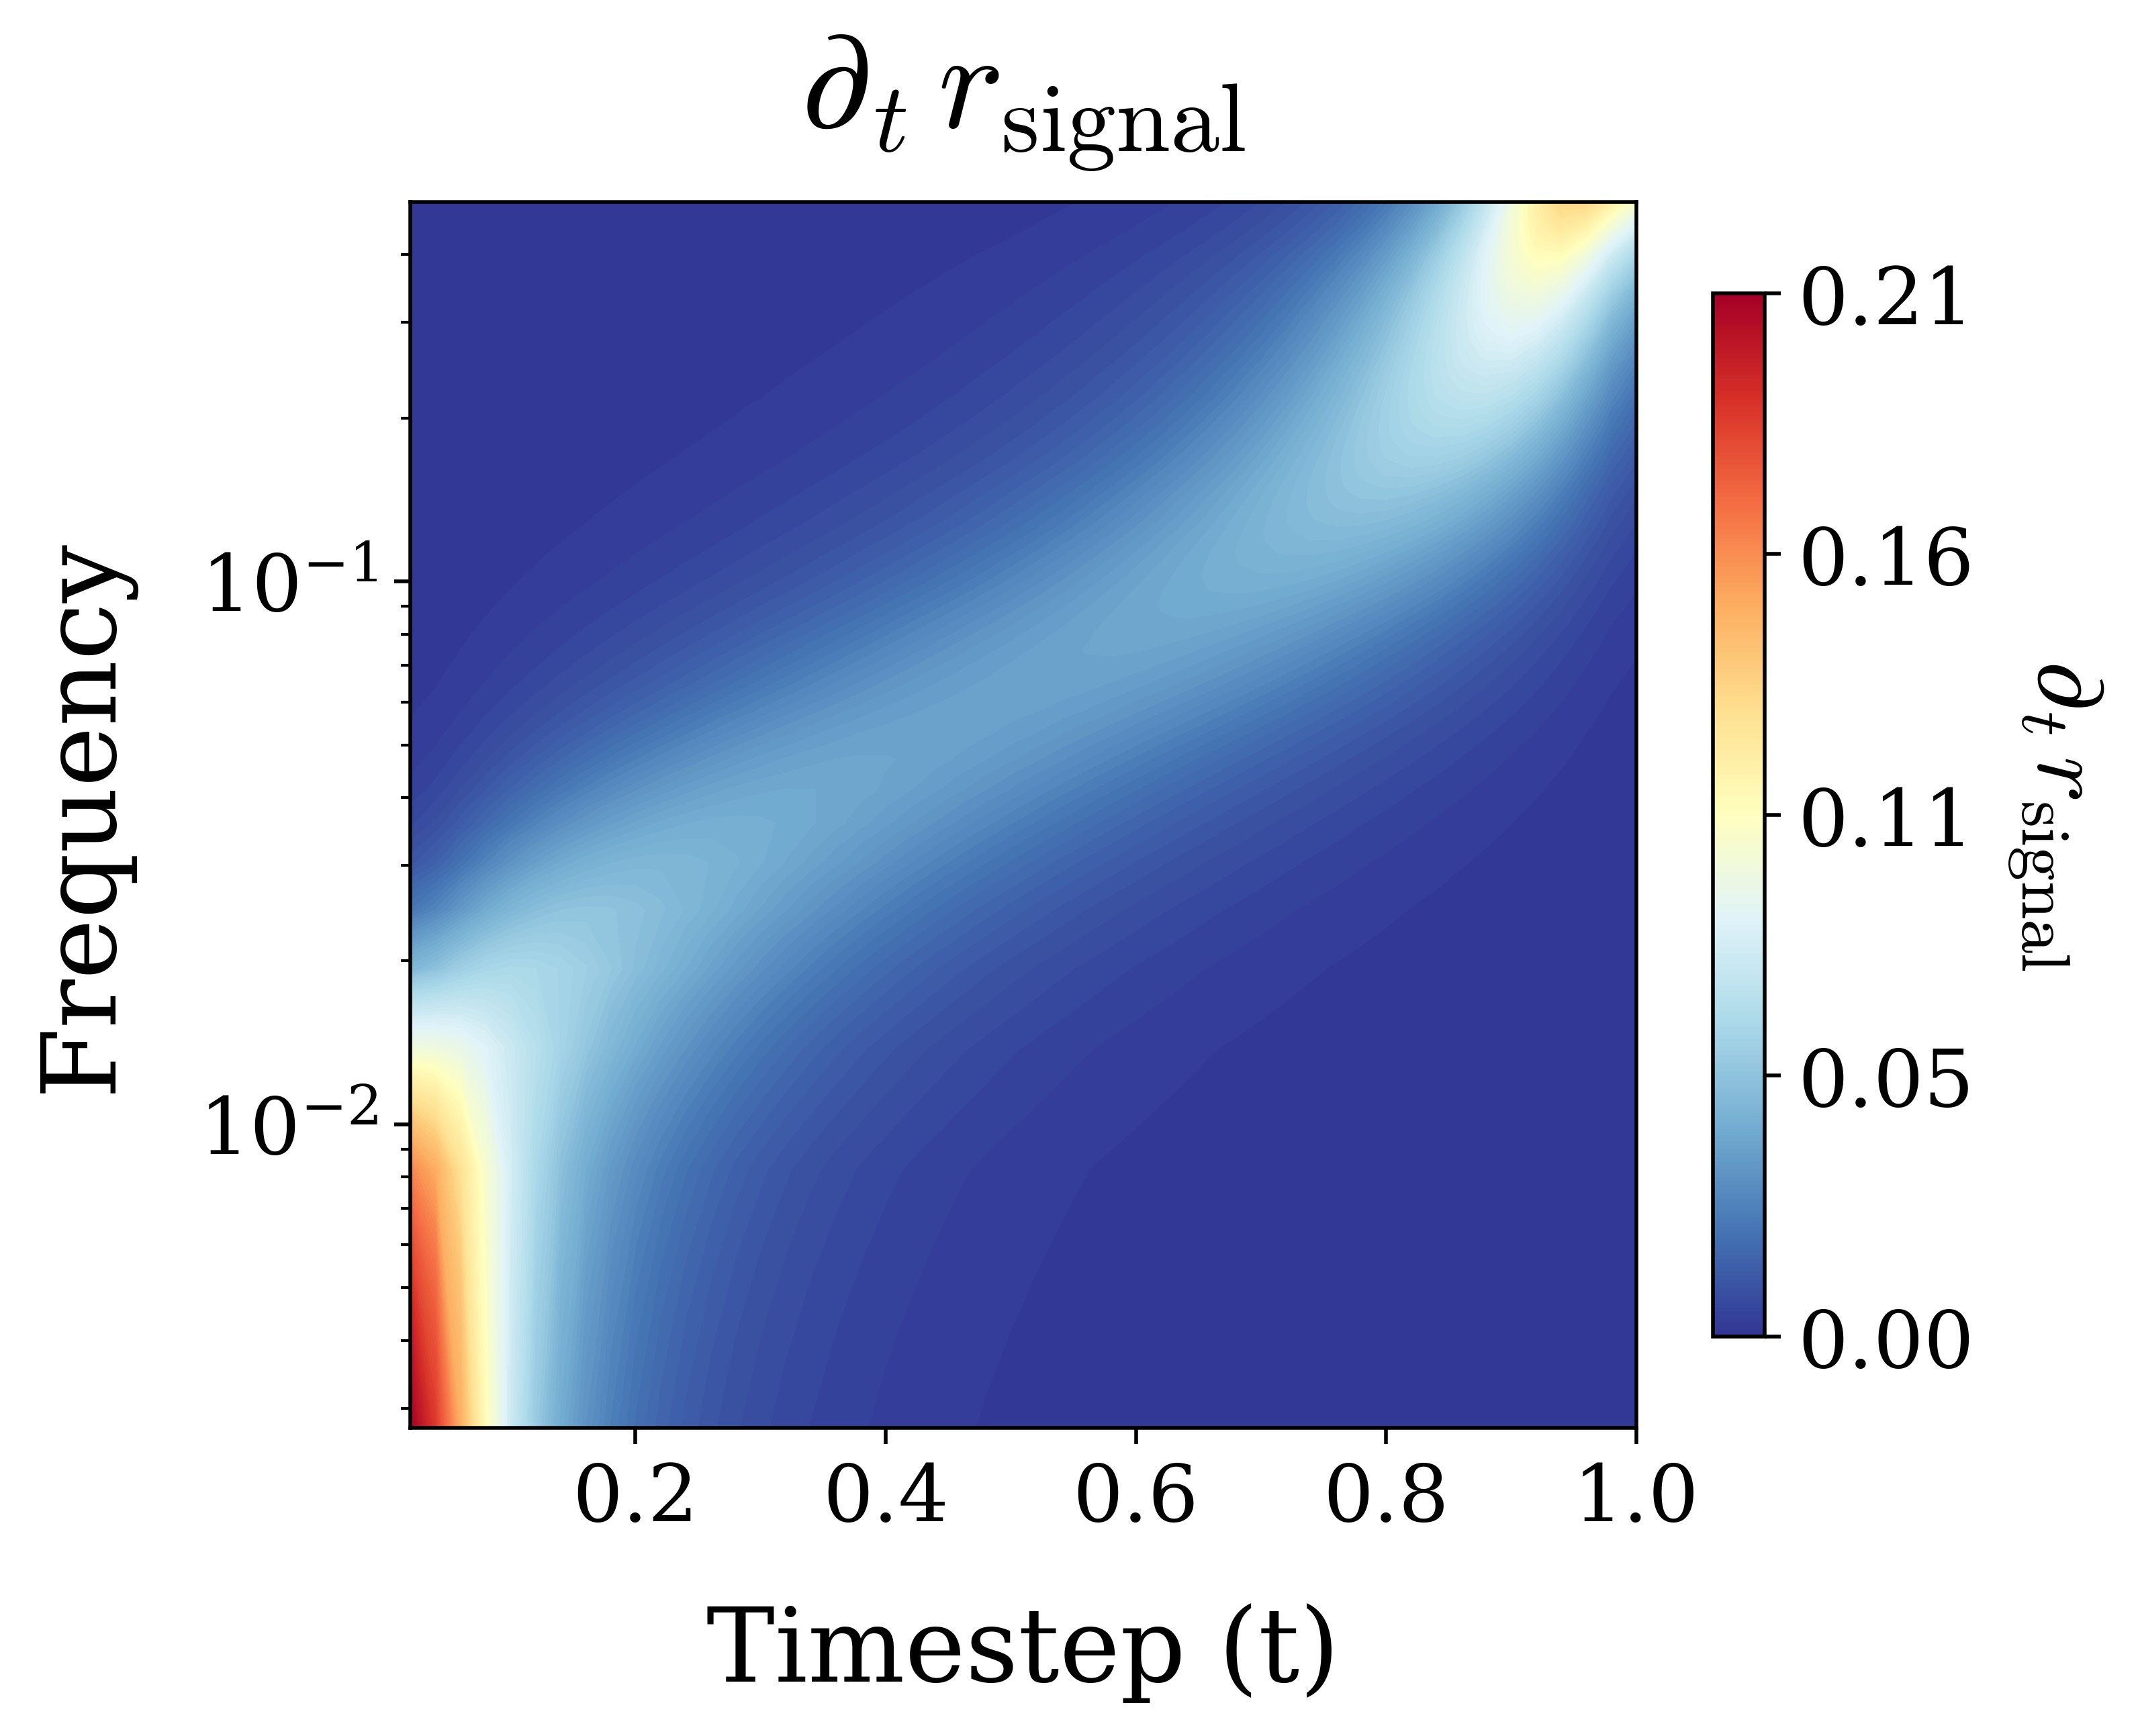
In the plots, we use at = t and bt = 1-t, therefore, t = 0 corresponds to pure noise and t = 1 corresponds to the clean image.
For a noisy image at time t, we measure the fraction of each frequency's power that comes from the clean image rather than the noise. Near 0, all frequencies are noise-dominated; near 1, most are already settled and won't change much further with continued denoising.
Closed-form retained signal — a normalized SNR per frequency, per timestep.
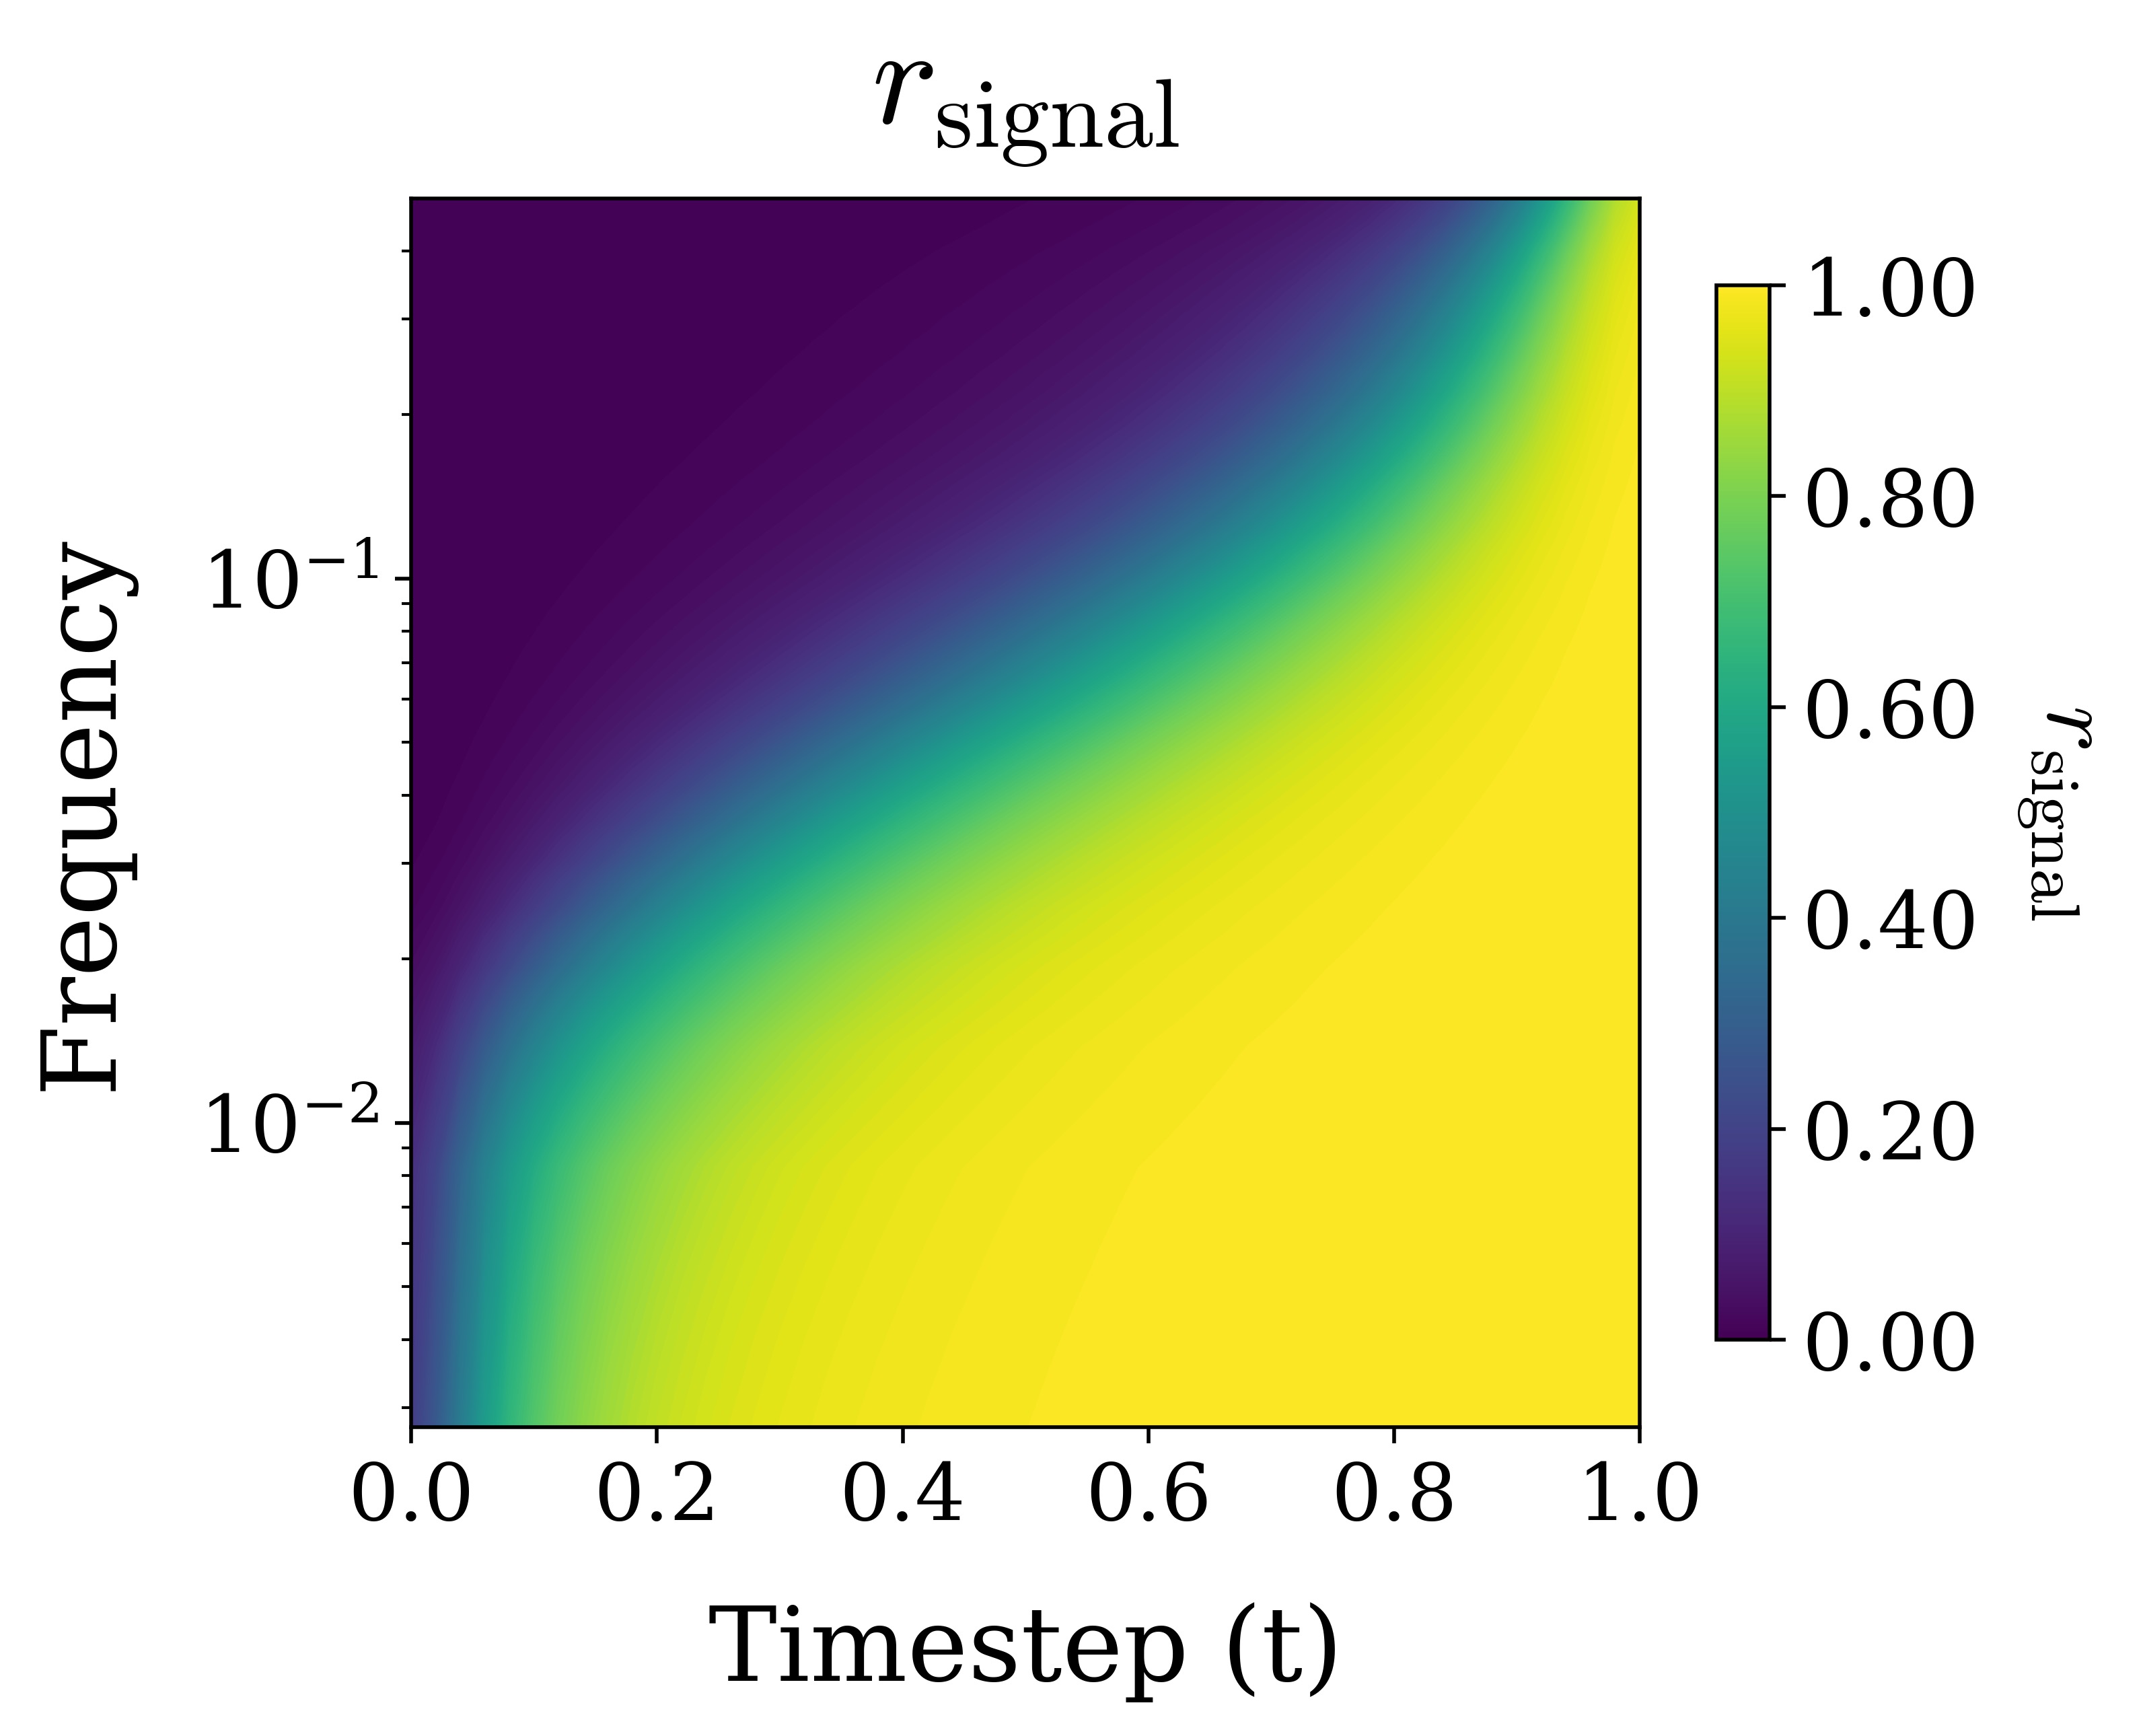
Retained signal alone only says how destroyed a frequency is — not what's changing. So we take the stepwise increase in retained signal over an interval [t, t+Δt] (or its continuous form, ∂ₜr). This is the amount of newly recoverable frequency content at that point in denoising — the measure of what the model is reconstructing right now.
Stepwise information gain — how much of frequency f becomes newly recoverable over [t, t+Δt].
We combine the newly recoverable content at each step with the Contrast Sensitivity Function (CSF). This emphasizes frequency bands that are most visible to people, and therefore, timesteps which correspond to these frequencies.
CSF-weighted newly recoverable frequency content.
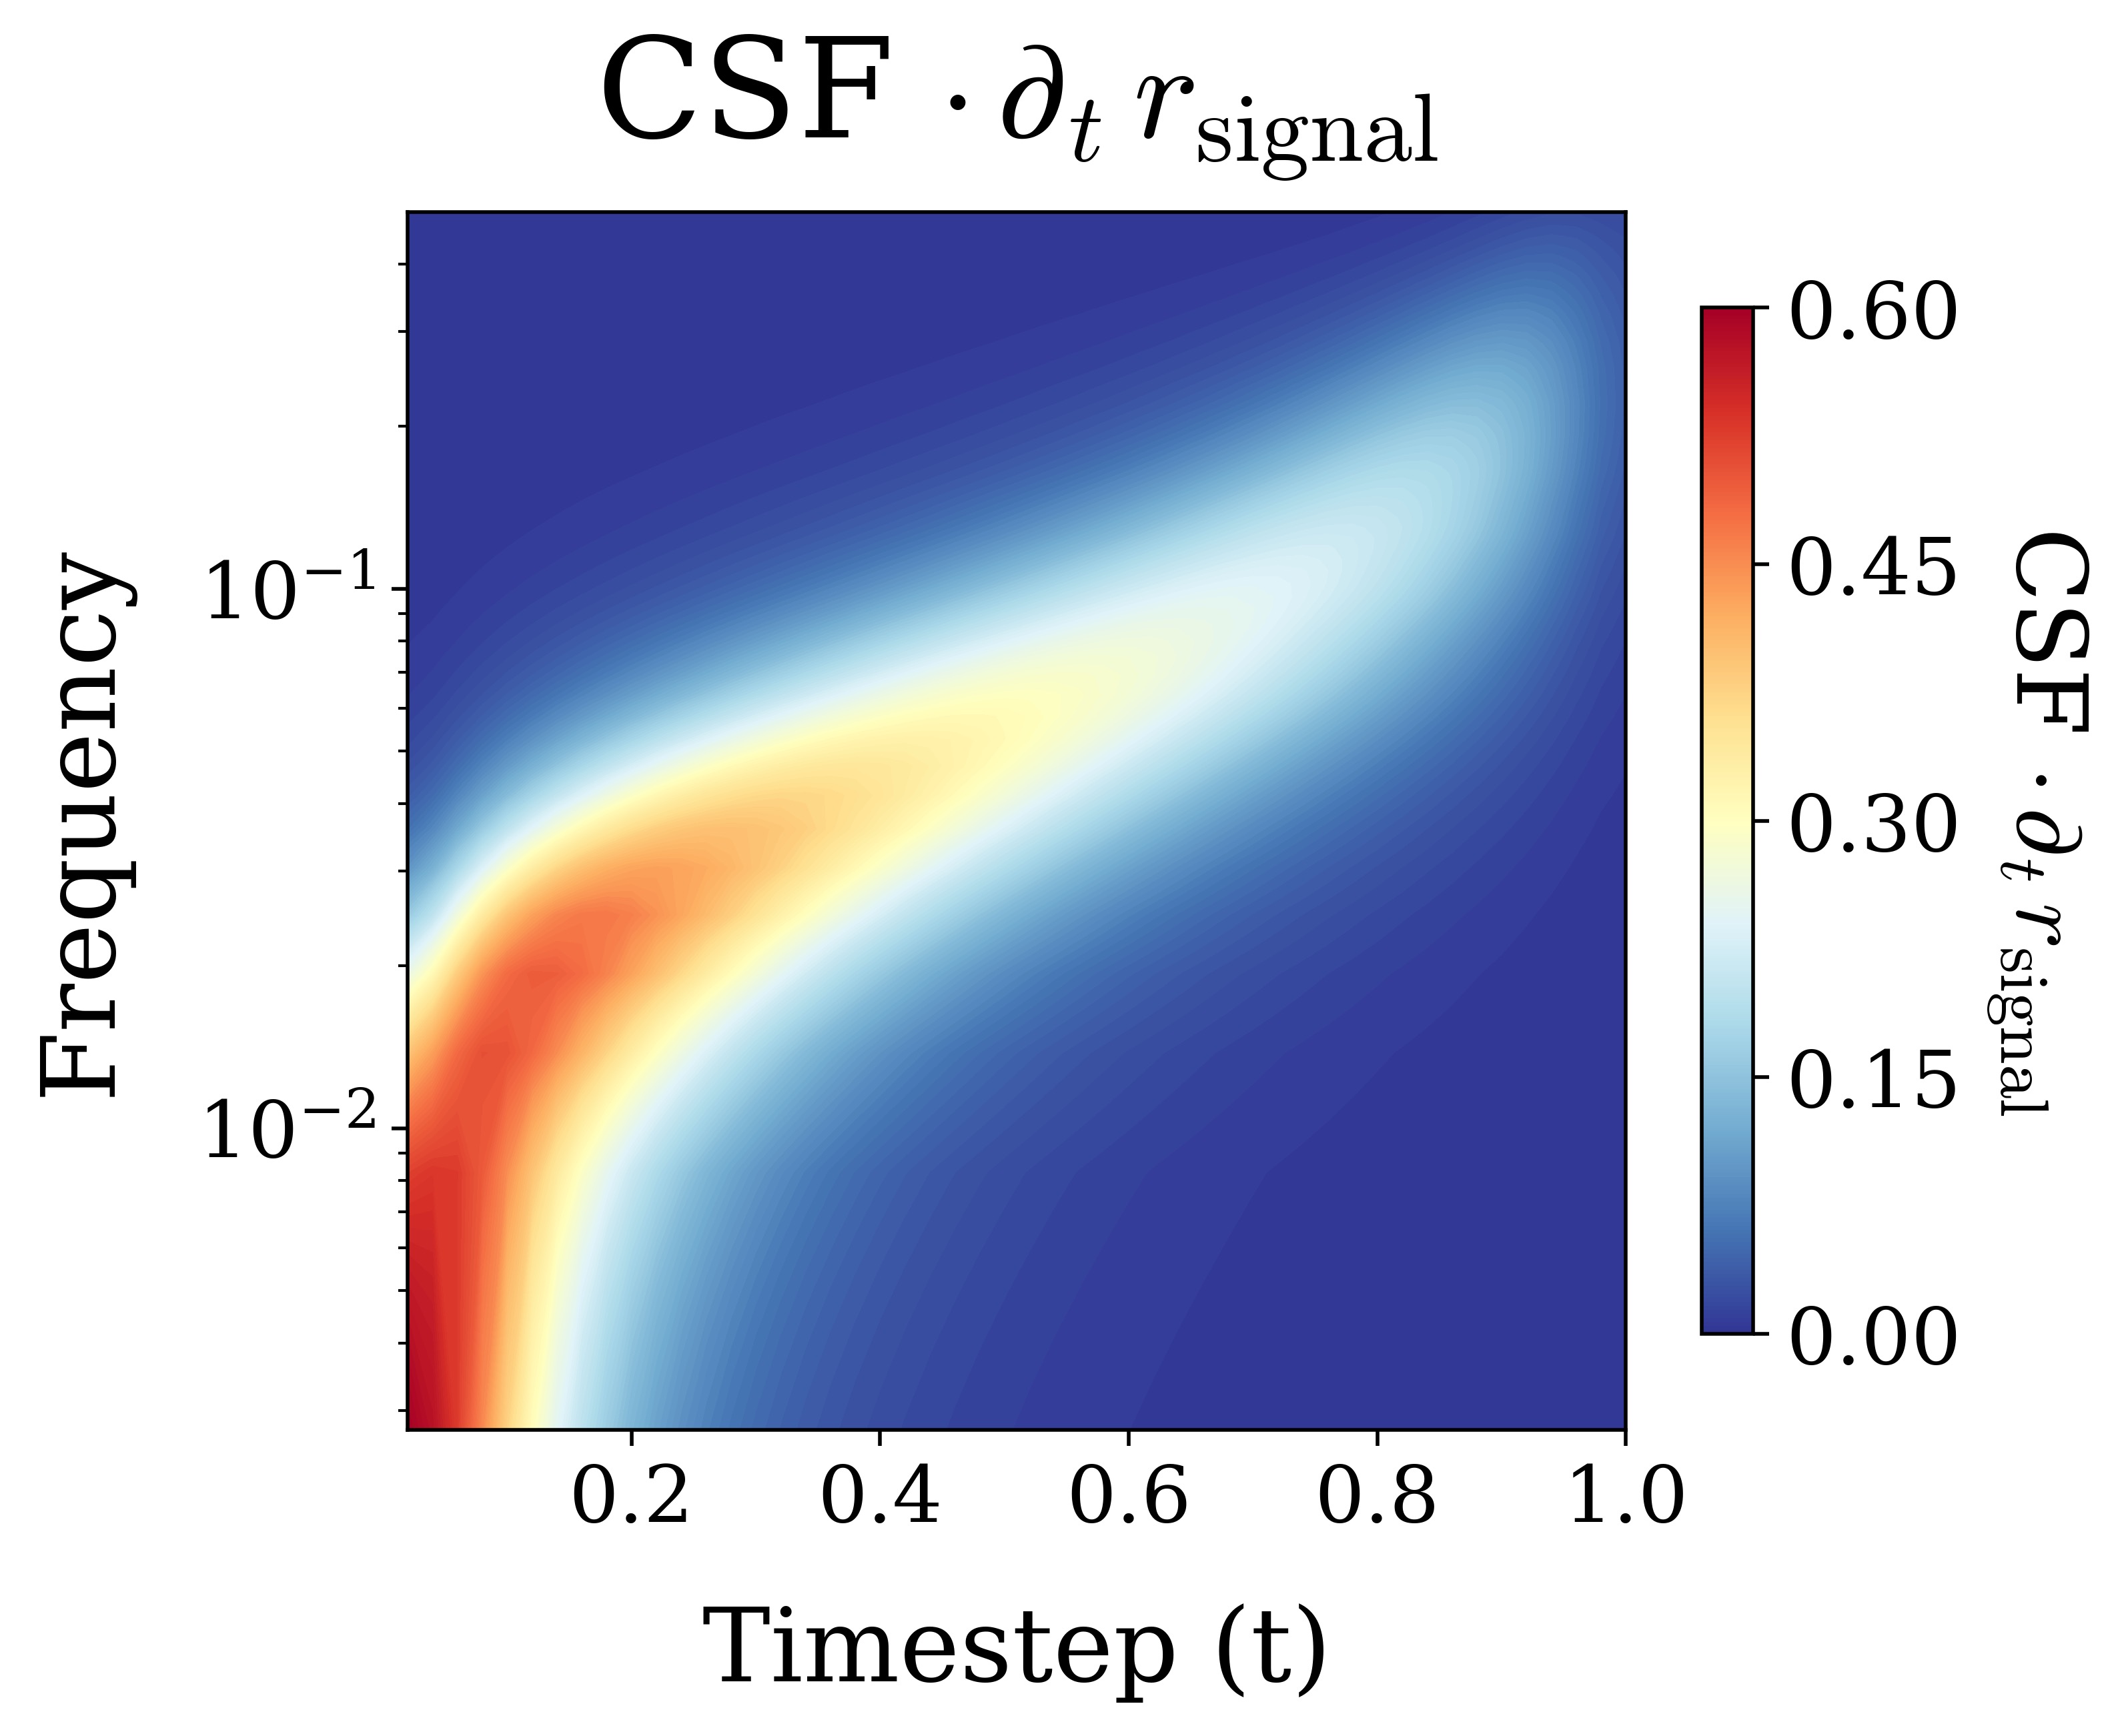
We aggregate the previous CSF-weighted importance across frequencies: each timestep is weighted by the average CSF of the frequencies newly recovered at that time.
Final perceptual timestep weights.
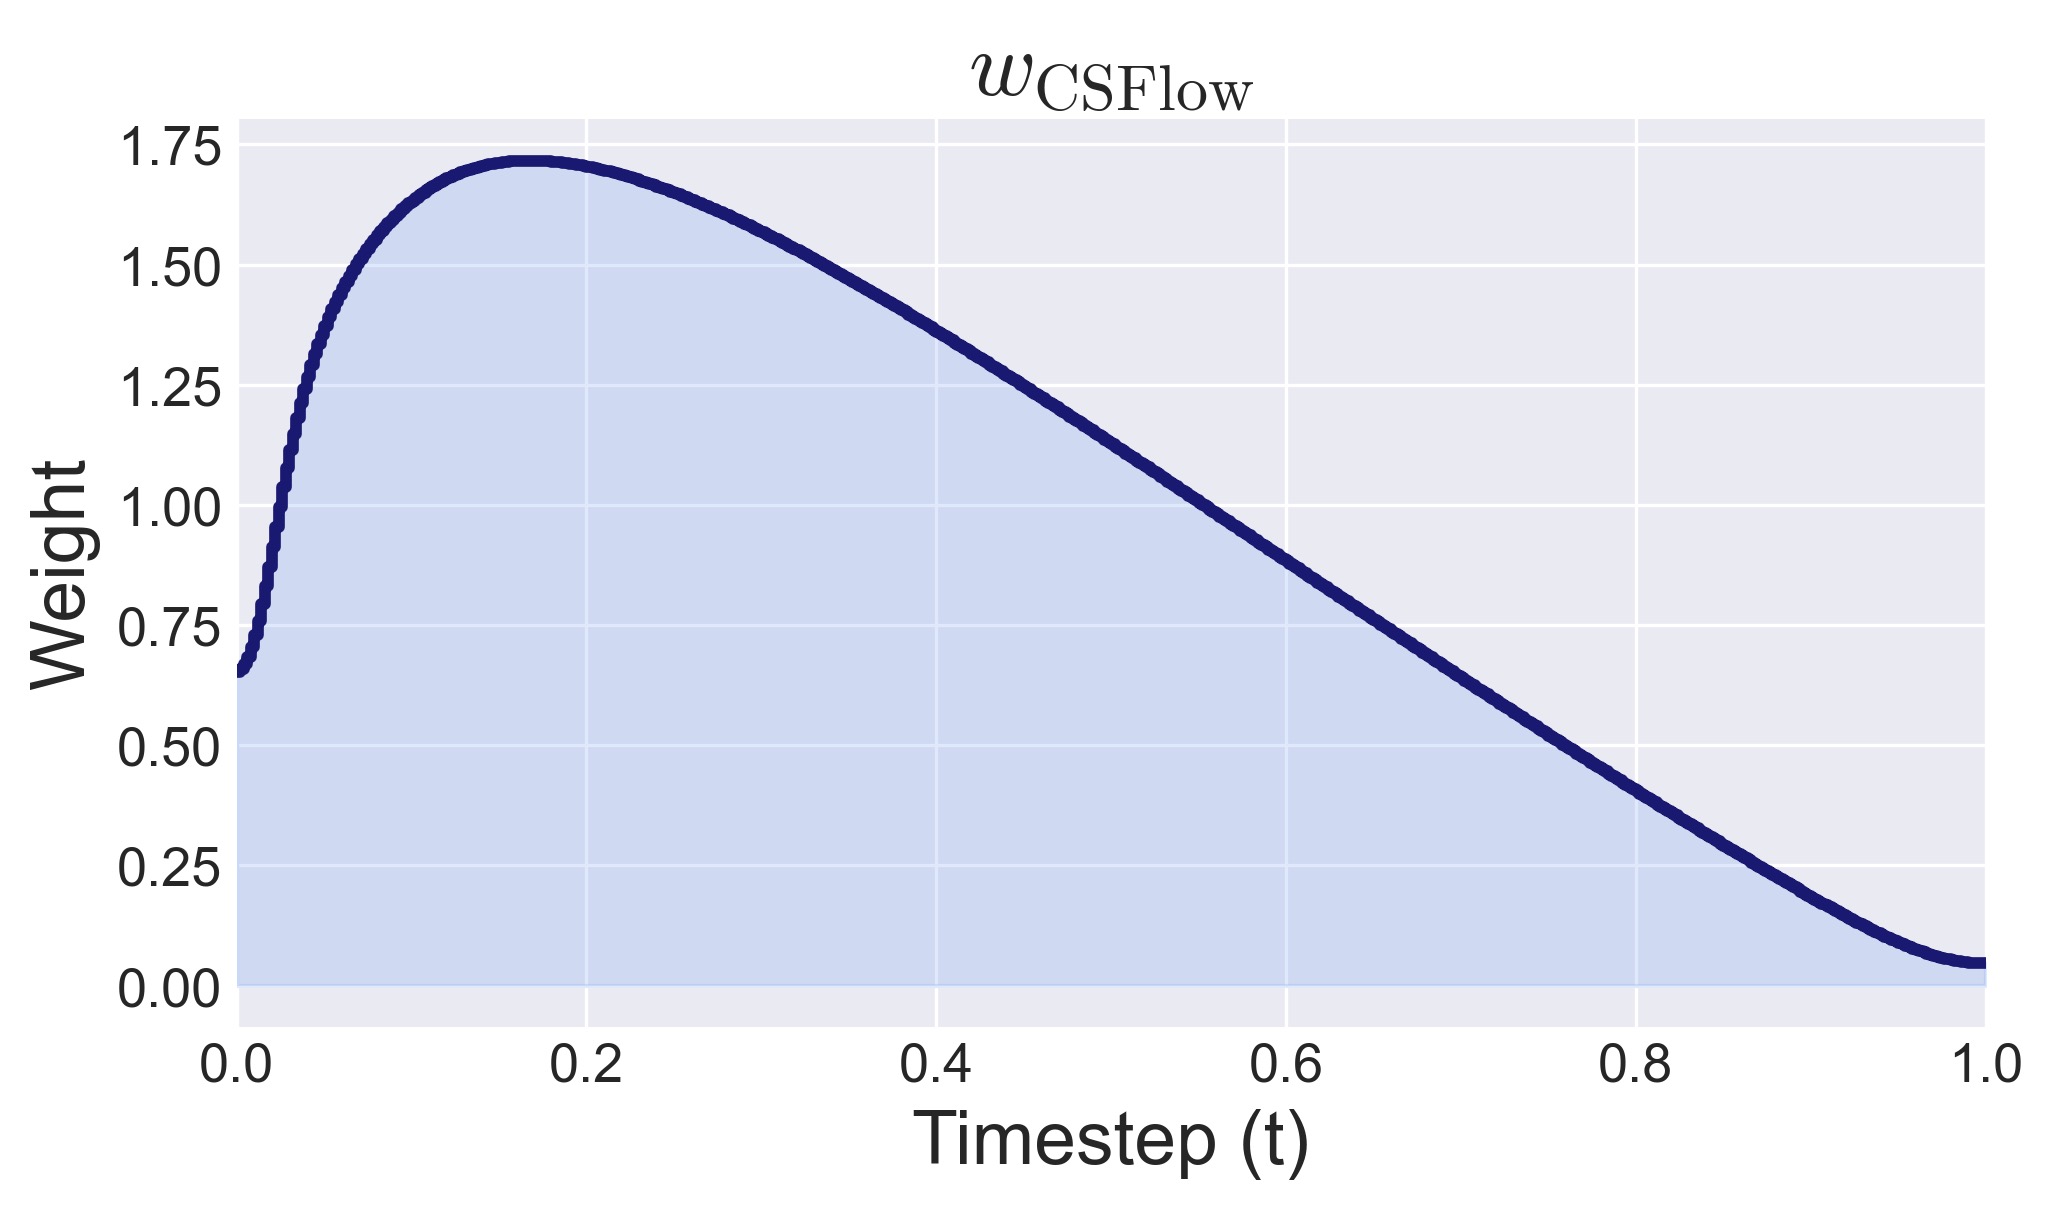
All plots use 50 uniform steps. At inference, the resulting weights reshape the timestep grid — we allocate smaller steps where perceptually important frequencies are reconstructed. In training, we bias which noise levels get sampled more often.
We evaluate models with CSFlow and two other perceptually-driven weightings. We use PixelGen-XXL on text-to-image generation and report GenEval, and JiT-H, PixelREPA-H, and PixelGen-XL on class-to-image generation and report FID and Inception Score. Scores are averaged over five runs, with confidence interval set to 2 standard deviations. The displayed interpolation settings are the best-performing configurations for each method.
| Method | Inference-only | Finetuning-only | Finetuning + inference |
|---|---|---|---|
| Baseline (no reweighting) | 0.791 ± 0.0018 | 0.789 ± 0.0024 | 0.789 ± 0.0024 |
| Weights applied directly | |||
| P2 | 0.778 ± 0.0024 | 0.809 ± 0.0031 | 0.806 ± 0.0005 |
| MinSNR | 0.765 ± 0.0023 | 0.786 ± 0.0011 | 0.758 ± 0.0026 |
| CSFlow (ours) | 0.798 ± 0.0025 | 0.810 ± 0.0004 | 0.797 ± 0.0011 |
| Interpolated with the base weights (individual best setup) | |||
| P2 | 0.792 ± 0.0040 | 0.809 ± 0.0031 | 0.806 ± 0.0005 |
| MinSNR | 0.788 ± 0.0048 | 0.786 ± 0.0011 | 0.788 ± 0.0013 |
| CSFlow (ours) | 0.798 ± 0.0025 | 0.810 ± 0.0004 | 0.813 ± 0.0022 |
| Method | JiT-H | PixelREPA-H | PixelGen-XL | ||
|---|---|---|---|---|---|
| Inference-only | Finetuning-only | Finetuning + inference | Inference-only | Inference-only | |
| FID ↓ | |||||
| Baseline | 1.89 ± 0.022 | 1.89 ± 0.038 | 1.89 ± 0.038 | 1.81 ± 0.030 | 1.88 ± 0.034 |
| P2 | 1.84 ± 0.022 | 1.86 ± 0.042 | 1.78 ± 0.030 | 1.62 ± 0.008 | 1.89 ± 0.022 |
| MinSNR | 1.84 ± 0.022 | 1.90 ± 0.026 | 1.86 ± 0.042 | 1.68 ± 0.018 | 1.88 ± 0.026 |
| CSFlow (ours) | 1.80 ± 0.020 | 1.89 ± 0.010 | 1.78 ± 0.040 | 1.59 ± 0.010 | 1.85 ± 0.030 |
| Inception Score ↑ | |||||
| Baseline | 297.2 ± 3.20 | 294.1 ± 3.98 | 294.1 ± 3.98 | 316.6 ± 2.30 | 292.7 ± 6.68 |
| P2 | 297.4 ± 3.52 | 298.9 ± 2.78 | 302.9 ± 2.06 | 316.7 ± 4.68 | 295.3 ± 2.84 |
| MinSNR | 302.6 ± 1.72 | 290.8 ± 1.88 | 291.6 ± 1.46 | 320.9 ± 1.30 | 294.0 ± 4.16 |
| CSFlow (ours) | 299.7 ± 3.58 | 299.2 ± 3.56 | 303.5 ± 2.76 | 320.8 ± 4.66 | 301.5 ± 2.54 |
Interpolated with the base weights (individual best setup). All interpolation parameters are reported in the paper.
@misc{csflow2026,
      title={CSFlow: Aligning Flow Matching with Human Contrast Sensitivity},
      author={Malgorzata Galinska and Bart Pogodzinski and Jan Eric Lenssen},
      year={2026},
      url={https://arxiv.org/abs/2606.08833},
}